St. Augustinegrass
Breeding for cold tolerance
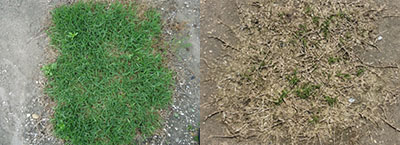
St. Augustinegrass is a desirable turfgrass because of its shade tolerance and relatively low input requirements, but it has poor cold tolerance. Our goal is to increase this grass’ adaptability area by improving its cold tolerance. This project includes multiple aspects including QTL mapping, the use of freezing tests in the laboratory to elucidate the physiological aspects of cold tolerance and to develop better screening methodologies, and field evaluations in the mountains of North Carolina where higher elevations allow for better selection pressure.
Mapping QTL for cold tolerance
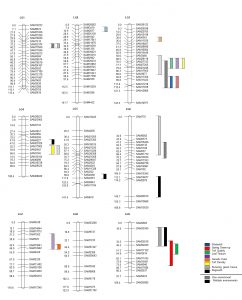 SSR and AFLP markers were used in a pseudo-F2 population of Raleigh x Seville to build the first complete linkage map of St. Augustinegrass. A total of 160 simple sequence repeat markers were mapped to nine linkage groups (LGs) covering a total distance of 1176.24 cM. To demonstrate the usefulness of the map, quantitative trait loci (QTL) were mapped controlling field winter survival, laboratory-based freeze tolerance, and turf quality traits. Multiple genomic regions associated with these traits were identified. Moreover, overlapping QTL were found for winterkill and spring green up on LG 3 (99.21 cM); turf quality, turf density and leaf texture on LG 3 (68.57-69.50 cM); and surviving green tissue and regrowth on LGs 1 (38.31 cM), 3 (77.70 cM), 6 (49.51 cM), and 9 (34.20 cM). Additional regions, where QTL identified in both field and laboratory based/controlled environment freeze testing co-located, provided strong support that these regions are good candidates for true gene locations. These results present the first complete linkage map produced for St. Augustinegrass, providing a template for further genetic mapping.
Breeding for southern chinch bug tolerance
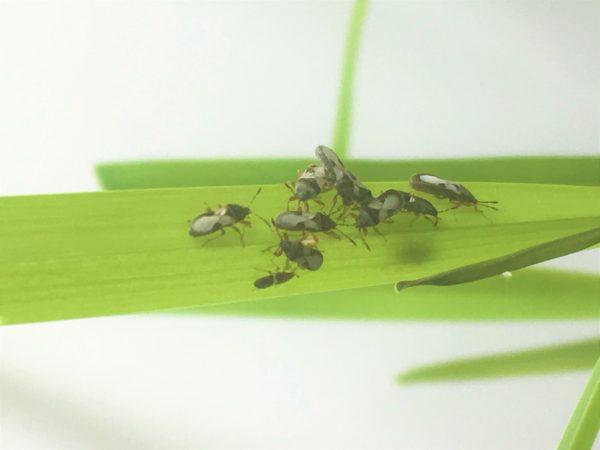 St. Augustinegrass is known to accumulate thatch, making it ideal for insect and disease problems. In the case of insects, the Southern chinch bug is the most economically important pest affecting St. Augustinegrass. We are currently focusing on mapping QTL associated with Southern chinch bug (SCB) resistance. We identified germplasm with high levels of antibiosis as well as tolerance to this insect pest. Our goal is to identify genetic markers linked to SCB resistance, which will be used to increase the efficiency of crossing and breeding strategies to ultimately generate new St. Augustinegrass cultivars that will require less pesticide use.
Polyploid Breeding
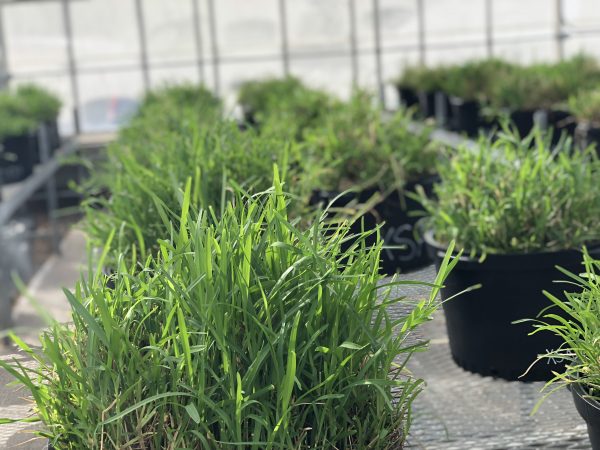 Polyploid genotypes of St. Augustinegrass are more resistant against several biotic stresses such as pests and pathogens (insects, nematodes, virus, and diseases). Exploitation of this variation has been slow due to the complications in crossing genotypes of different ploidy levels. With the use of colchicine, we have successfully developed stable artificial tetraploid lines from cultivar Raleigh. Currently, we are working on using these lines as bridge for crosses with polyploids of interest. Progenies form these lines will be planted in the field for further evaluations.
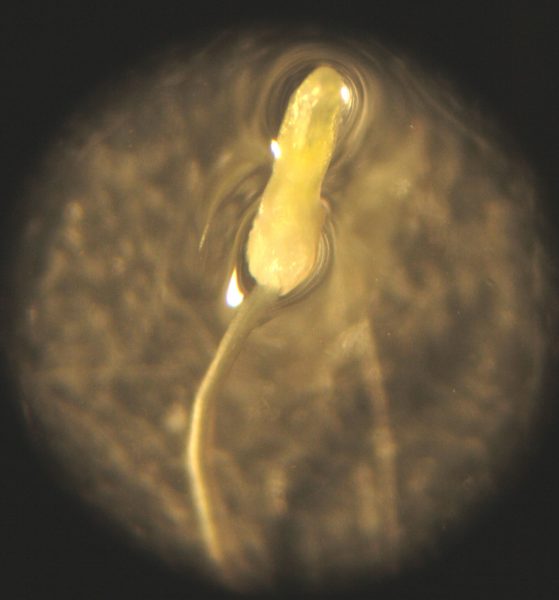 In bermudagrass, crossing tetraploid genotypes with diploid genotypes to produce sterile triploid hybrids has been a common breeding methodology to ensure varietal purity in turf stands (as in sod production or golf courses). Using this model in St. Augustinegrass is beneficial to both sod producers and turf managers who require purity for certification and uniformity for performance. We are working on the creation of triploid lines of St. Augustinegrass. Diploid St. Augustinegrass are used as female parents to be crossed with tetraploid lines of interest. Viable plants will be developed by using the embryo rescue technique.
Mapping QTL for gray leaf spot resistance
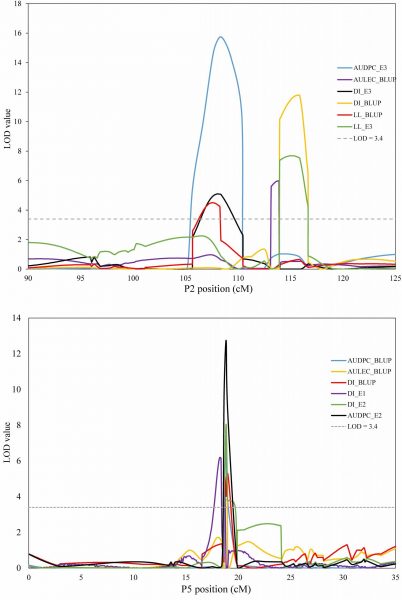
Genetic linkage maps of St. Augustinegrass have been constructed for quantitative trait loci (QTL) analysis of resistance to gray leaf spot using a total of 2768 SNP markers on a pseudo F2 population of 153 progeny. GLS resistance was evaluated under controlled environmental conditions in three independent runs with measurements of final disease incidence and lesion length. Additionally, two derived traits, area under the disease progress curve (AUDPC) and area under the lesion expansion curve (AULEC) were calculated for QTL analysis. A total of 20 putative QTL were identified confering GLS resistance related triats, explaning 7.6 – 37.2 % of phenotypic variation. The two major effect QTL glsp2.3 and glsp5.2 together can improve 20.2% of disease resistance.
Genomic analysis of St. Augustinegrass
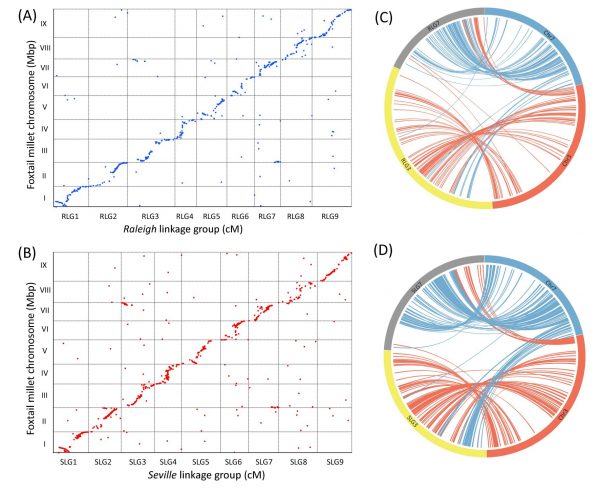 High-density linkage maps for St. Augustinegrass were constructed using a genotyping by sequencing (GBS) approach from ‘Raleigh x Seville’ population. The integrated linkage map consists of 2871 single nucleotide polymorphism (SNP) and 81 simple sequence repeat (SSR) markers, spanning 1241.7 cM, with an average distance of 0.4 cM between markers. Comparative genomic analysis revealed the high degree of synteny and collinearity between St. Augustinegrass and other grass species, like foxtail millet, sorghum, and rice. However, interchromosome arrangements and independent nested chromosome fusion events were also observed.
Mapping QTL for drought tolerance
A multiyear and multi-environment study was performed to identify QTL in a ‘Raleigh x Seville’ mapping population segregating for phenotypic traits associated with drought tolerance.Phenotypic data was collected from a field trial and a two-year greenhouse study, which included relative water content (RWC), chlorophyll content (CHC), leaf firing (LF), leaf wilting (LW), green cover (GC) and normalized difference vegetative index (NDVI). Significant phenotypic variance was observed and a total of 70 QTL were detected for all traits. A genomic region on linkage group R6 simultaneously harbored QTL for RWC, LF and LW in different experiments. In addition, overlapping QTL for GC, LF, LW and NDVI were found on linkage groups R1, R5, R7 and S2. Sequence alignment analysis revealed several drought response genes within these regions.
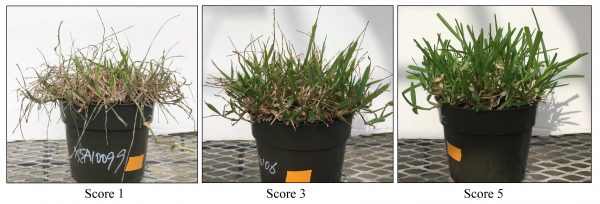
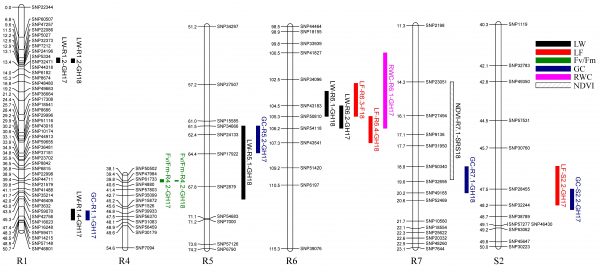
A new mapping population was developed from cross of two contrasting drought tolerance parents to validate putative QTL. This population will be evaluated for the same drought traits as before using a multiyear and multi-environment study. New high throughput phenotyping tools like UAV will be used to collect drought evaluation data.
Using Unmanned Aerial Vehicles (UAVs) for Drought Stress Phenotyping
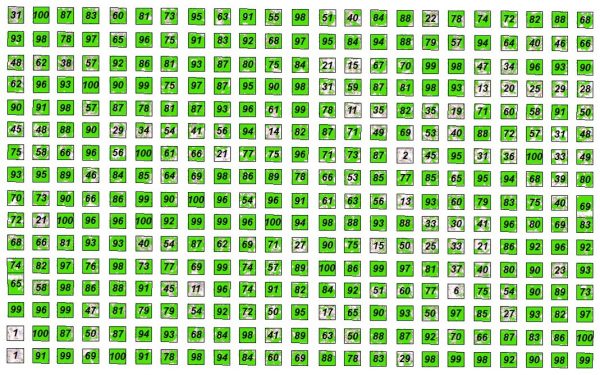 Many drought traits that our program has previously phenotyped on the ground have the potential to be more efficiently collected aerially using sensors and cameras mounted to UAVs. Traits including normalized difference vegetation index (NDVI), percent green cover, and canopy temperature can be measured with multispectral, RGB, and thermal cameras, respectively. These photos can then be processed to extract information on a plot-level basis. Several crops have successfully implemented such systems, but their use in turfgrass remains relatively unexplored. This project aims to compare phenotypic ratings from both the ground and air with the goal of helping the turfgrass breeding program transition from its current system of visual ratings to a more quantitative system with an image analysis pipeline. Evaluating turfgrass characteristics this way will help increase standardization across trials and years, making comparative analysis of breeding lines more reliable.